
Convequity's AI Bubble Barometer
We share the methodology behind the Convequity AI Bubble Barometer


Summary
The AI Bubble Barometer provides a transparent, data-driven framework that compares forward ROIC with market valuations (EV/IC) to assess whether AI-related investments by the major hyperscalers are supported by fundamentals.
In Week 4, EV/IC eased further to 6.60x while the group’s forward ROIC remains at 3.07x, keeping valuations within the fair value range with no bubble signal.
Large-scale compute contracts between SpaceX and both Anthropic and Google demonstrate strong, contracted demand for AI infrastructure and highlight the emergence of new players alongside traditional hyperscalers.
AI adoption and token usage remain heavily concentrated in software engineering and developer communities, with 77% of employees in high-adoption organisations using coding assistants, while other verticals such as legal, accounting, and healthcare are still at earlier stages.
As token costs decline and agentic capabilities improve, AI usage is expected to diffuse more broadly across industries, though the recent IPO from SpaceX and upcoming IPOs from Anthropic, and OpenAI may create periods of tighter liquidity for AI-related investments.
We have now been publishing the Convequity AI Bubble Barometer for four weeks. In case you have not yet seen it on our website, this report provides a full overview of the framework — including what it aims to achieve and how it has been constructed — along with this week’s update and some high-level perspectives on the current AI market landscape.
The Barometer is designed to offer a transparent, data-driven way of assessing whether AI-related valuations among the major hyperscalers are supported by underlying fundamentals. Each edition compares forward returns on invested capital with prevailing market multiples to identify potential divergence between economic reality and investor pricing.
You can access the full interactive dashboard at any time here: barometer.convequity.com
AI Bubble Barometer — Week 4 | 12 June 2026
This week’s update shows a further easing in market valuations while underlying fundamentals remain stable. You can view the full interactive dashboard here: barometer.convequity.com
Key Metrics (as of 12 June 2026)
ROIC / WACC: 3.07x in Q1’26 (up from 2.97x in Q4’25)
ROIC – WACC Spread: +21.9% (up from +20.9%)
EV / IC: 6.60x (down from 7.10x last week)
Aggregate EV / Ann. 2-Yr Forward NOPAT: 50.60x (down from 54.0x)
ROIC and WACC are updated quarterly, while EV/IC and the NOPAT multiple move weekly with market prices.
Signal
At 6.6x EV/IC, with the basket generating ~20% NTM revenue growth and ~32% forward ROIC, valuations have cooled further and now sit comfortably within the fair value range. There is no bubble signal at present. The market is paying less for the same (or slightly improving) fundamental returns, which is directionally positive.
Week 4 of the series. Updates are published every Friday.
Commentary
Recent deals between SpaceX and two of the largest AI developers underscore both the explosive demand for compute and the emergence of new, non-traditional players in the AI infrastructure supply chain. In early May, Anthropic secured exclusive access to SpaceX’s Colossus 1 data center in Memphis, committing to roughly $1.25 billion per month through May 2029 — a potential contract value exceeding $45 billion. The arrangement provides Anthropic with over 220,000 Nvidia GPUs and more than 300 MW of power, primarily to support inference workloads for its Claude models. Shortly afterward, Google disclosed a separate agreement worth approximately $920 million per month from October 2026 through mid-2029, securing access to around 110,000 Nvidia GPUs in SpaceX facilities for a potential total of $29–30 billion.
These contracts are notable not only for their size but for what they reveal about the current state of AI infrastructure. They demonstrate that demand for large-scale, reliable compute continues to outpace traditional hyperscaler capacity in certain segments, prompting AI labs to turn to alternative providers. They also highlight SpaceX’s strategy of monetizing underutilized or newly built infrastructure at attractive economics, while simultaneously advancing its longer-term ambitions in orbital AI compute. For the broader market, these deals represent real, contracted revenue rather than speculative projections — a reminder that while AI capex remains extremely high, it is increasingly backed by multi-year commercial commitments.
To many people outside the technology and investment industries, the sheer scale of spending and excitement around AI can still feel somewhat abstract. Beyond the everyday experience of using ChatGPT or similar tools, it is not always obvious where the value is being created. The reality today is that AI token consumption and productive usage remain heavily concentrated in developer and engineering communities. In high-adoption organisations, 77% of employees now use coding assistants. Software engineering currently shows some of the highest adoption rates and the most measurable productivity gains of any vertical, with studies indicating average productivity improvements of 15–20% for developers using AI coding tools, and gains reaching 35–40% on certain greenfield or lower-complexity tasks. Marketing and sales functions also show relatively advanced adoption. In contrast, verticals such as legal, accounting, healthcare, and many areas of professional services are still at earlier stages, often limited to narrower use cases.
This concentration helps explain why the current wave of investment can feel disconnected from everyday experience. At the same time, the recent SpaceX IPO, introduces a significant liquidity consideration for public markets. A valuation in the region of $2 trillion makes SpaceX the largest IPO in history by a wide margin and could absorb substantial capital from both institutional and retail investors. Looking further ahead, potential IPOs from Anthropic and OpenAI would likely exert additional pressure on available liquidity. These events, combined with the sheer scale of capital still required to expand AI infrastructure, suggest that the funding environment for AI-related companies may become more selective in the medium term, even as underlying demand remains robust.
Taken together, these developments reinforce two themes that run through the AI Bubble Barometer: the enormous capital intensity of the current build-out and the growing gap between companies that can secure large, contracted offtake agreements and those that cannot. While the recent SpaceX deals provide tangible evidence of commercial demand, they also illustrate how quickly the competitive and capital landscape is evolving. As the cost of tokens continues to decline and models develop stronger agentic capabilities, usage is expected to diffuse more broadly — from coding into legal research, accounting, marketing, healthcare, and eventually more consumer-facing applications. The current concentration of activity should therefore be viewed as an early phase rather than the end state.
Methodology
Purpose and Philosophy
The AI Bubble Barometer is designed to provide a quantitative, regularly updated framework for assessing whether the market’s valuation of AI-related investments by the major hyperscalers is supported by fundamentals or is showing signs of excess.
While investor sentiment around AI is often polarised (“bubble” vs “not a bubble”), there has been no transparent, repeatable metric that directly compares the market’s implied return expectations (via EV/IC) with the actual economic returns being generated on the capital being deployed. The Barometer fills that gap by focusing on the single most important long-term driver of shareholder value: Return on Invested Capital (ROIC).
Rather than relying on historical (trailing) ROIC, which can be distorted by the early-stage nature of AI build-outs, we estimate a forward-looking ROIC over a two-year horizon. This forward ROIC is then compared with both the cost of capital and the market’s current valuation multiple (EV/IC).
Core Framework
The Barometer compares two sides of the same equation:
Fundamental side: Two-year forward ROIC (annualised) versus WACC.
Market side: Enterprise Value / Invested Capital (EV/IC).
When these two measures move in tandem, valuations are broadly consistent with fundamentals. When they diverge, a signal emerges:
EV/IC rising while ROIC/WACC is flat or falling → Potential bubble formation (market paying more for the same (or lower) economic returns).
EV/IC falling while ROIC/WACC rises → Improving attractiveness.
We present both the ROIC/WACC ratio and the ROIC – WACC spread, but the ratio is the primary comparison tool because it maps directly onto the EV/IC multiple under steady-state assumptions.
Calculating the Denominator: AI-Related Invested Capital
The denominator of forward ROIC is the capital actually deployed into AI infrastructure.
We take each hyperscaler’s total capex over the trailing 24 months.
We apply an 85% haircut to estimate the portion attributable to AI (data centres, servers, networking, power, etc.). This factor is derived from management commentary, segment disclosures, and the clear acceleration in AI-related spending visible in recent quarters.
The resulting figure represents the AI-specific invested capital deployed over the past two years that is expected to generate returns over the next two years.
We use a two-year window (rather than one year) to smooth out quarterly lumpiness in capex timing and to better align the capital base with the revenue it is expected to produce.
Estimating the Numerator: Two-Year Forward AI NOPAT
Starting Point – Remaining Performance Obligations (RPO)
Most hyperscaler revenue is contracted and therefore appears in Remaining Performance Obligations. We aggregate RPO across the group and then make two key adjustments to isolate AI-related revenue expected over the next 24 months:
Duration scaling: Not all RPO will convert to revenue in the next two years. We scale each company’s RPO down to a two-year horizon. For most names we apply company-specific factors informed by earnings-call commentary on average contract lengths. AI workloads often have longer durations than legacy cloud workloads (e.g., Amazon has disclosed multi-year AI commitments averaging ~5.5 years). We therefore haircut total RPO accordingly.
AI-specific haircut: Even within the scaled RPO, not all revenue is AI-related. We apply further haircuts based on management commentary:
Microsoft, Amazon, Google: 75%
Oracle: 90%
CoreWeave: 100% (entire business is AI-focused)
This produces an estimate of committed AI revenue expected over the next two years.
On-Demand Revenue Uplift
Not all revenue flows through RPO. A meaningful portion of AI-related demand is on-demand / pay-as-you-go (unplanned token consumption). We therefore apply an uplift factor. Our base case assumes ~75% of revenue is committed and ~25% is on-demand, which produces a 1.33x uplift to the committed AI revenue figure. Alternative scenarios (more or less on-demand) are also modelled for sensitivity.
Special Case: Meta
Meta does not disclose meaningful RPO (its business is predominantly advertising). We therefore use a different but transparent approach:
Take Meta’s trailing 24-month revenue.
Apply the consensus analyst CAGR for the next two years.
Apply a 60% factor to estimate the portion of that revenue that is attributable to AI-related activities (recommendation engines, ad targeting, content moderation, infrastructure supporting AI workloads, etc.).
This is admittedly the most judgmental part of the model. However, because Meta is a very large contributor to aggregate AI capex, excluding it would materially distort the group picture. We therefore include a conservative estimate rather than omit the company entirely.
From Revenue to NOPAT
Once we have an aggregate two-year forward AI revenue figure for the basket, we convert it to Net Operating Profit After Tax (NOPAT):
Apply a 34% weighted-average operating margin for the group (derived from segment-level margins and the mix of cloud vs other AI-related activities).
Apply a 21% effective tax rate.
Add back the tax shield from 100% bonus depreciation on AI capex (Trump-era policy allowing immediate expensing of qualifying AI infrastructure). The tax shield equals trailing 24-month AI capex × 21%.
This produces a tax-shield-adjusted two-year forward NOPAT.
Why a Two-Year Forward ROIC?
We deliberately calculate ROIC over a two-year horizon (rather than annualising a single year) for three reasons:
It smooths quarterly volatility in both capex and revenue recognition.
It better matches the capital deployed in the trailing 24 months with the revenue it is expected to generate.
It provides a more stable signal for comparing against the slowly moving WACC and the weekly-moving EV/IC.
The resulting two-year ROIC is then annualised for presentation and comparison purposes.
WACC Calculation
We calculate a group-level WACC using market data as of the most recent quarter-end:
Cost of equity: Risk-free rate (current 10-year Treasury yield) + beta × equity risk premium. We use Damodaran’s implied ERP (updated monthly) and each company’s 5-year beta.
Cost of debt: Derived from the average credit rating of the group.
Weights are based on market values of equity and debt.
Important consistency note on off-balance-sheet financing: We deliberately focus only on the capital and debt that will generate returns over the next 24 months. Future data-centre SPVs and associated debt will finance capex that produces revenue beyond our two-year window. By aligning the invested capital, the cost of debt, and the revenue forecast to the same 24-month period, the model remains internally consistent.
Deriving the Signal – ROIC/WACC vs EV/IC
Once we have the annualised two-year forward ROIC and the group WACC, we calculate:
ROIC / WACC ratio
ROIC – WACC spread (in percentage points)
We then compare these to the current EV/IC multiple of the basket.
The mathematical link is well-known: under steady-state assumptions,
EV/IC ≈ (ROIC – g) / (WACC – g).
Our framework therefore has internal coherence between the fundamental return metric and the market valuation metric.
EV/IC Thresholds
The current EV/IC thresholds are calibrated specifically to the basket’s present characteristics:
~20% NTM revenue growth
~32% forward annualised ROIC
WACC of ~10.5–11%
Capital-intensive nature of the businesses
Current thresholds (as of Q1 2026 data):
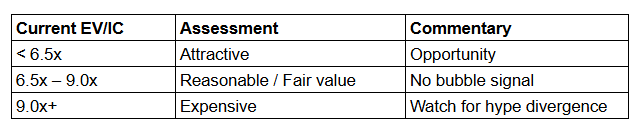
These bands are not fixed. They will be reviewed and updated whenever there is a material change in the group’s expected NTM growth or forward ROIC (typically each earnings season).
Key Assumptions & Limitations
The 85% AI capex haircut and the various RPO/AI-specific factors are informed by management commentary but remain estimates.
Meta’s AI revenue attribution is the most judgmental input.
On-demand uplift assumptions can be stress-tested; we show base, high, and low cases on the dashboard.
The model deliberately focuses on a two-year horizon to maintain internal consistency between capital deployed, revenue generated, and the cost of capital.
Off-balance-sheet financing for future capacity is excluded because it does not yet contribute to the revenue being measured.
The Barometer is therefore best viewed as a transparent, rules-based framework rather than a precise forecast. Its value lies in the consistency of the methodology over time and the clear signals that emerge when market valuations and fundamental returns diverge.